Antares Equities
Does company size matter when it comes to investment returns? Antares Equities explains.
A commonly held perception in investing is that small companies provide the best exposure to growth and hence capital appreciation in the investment universe. Is this really the case?

This article looks at the returns from three sub-indices across the Australian share market – large companies (eg our big banks and BHP), mid-sized (eg Seek or REA) and small companies (eg Mantra or iSelect). Which of these provides the best returns to investors?
We find that while size does matter, it is actually the mid-sized companies that in recent years have consistently delivered higher returns for investors than smaller companies and better capital returns than both large and small companies. This result is supported by the fact that, on average, through nearly all time periods and in all major share markets around the world, earnings per share growth for midsized companies is stronger than for either large or small companies.
While this might seem surprising at first, we think there are several good reasons why this is the case. Firstly, mid-sized companies can grow in their various industries as they are typically younger companies in younger industries. Younger industries usually experience rapid growth but as an industry matures, the rate of growth reduces. This means mid-sized companies are generally less exposed to disruption than companies in the larger cap market.
Further, they are more established than smaller companies, hence they are more self-reliant for capital to grow. They do not need new equity to generate growth, and so returns are better. Also, unlike many smaller companies, the business model has generally proven its durability and is less likely to fail.
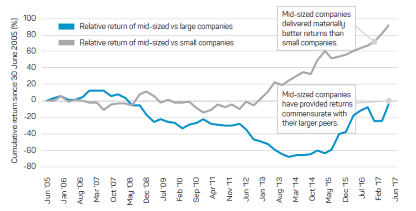
Chart 1 highlights the total shareholder return (TSR) of mid-sized companies relative to both larger and smaller companies since mid-2005.1

Source: Bloomberg, data to 30 June 2017. Past performance is not indicative of future performance.
Chart 1 shows that while mid-sized companies have provided returns commensurate with their larger peers, both mid-sized and large companies have delivered materially better returns than an equivalent investment in small companies. This outperformance is apparent in all time periods – from the last twelve months to the full twelve years measured here. The reason is simple: mid-sized companies have consistently provided better earnings per share (EPS) growth than larger and smaller companies.
We have discussed reasons for this outperformance above: namely that midsized companies have proven business models, with ample scope for growth and generally mature capital structures that provide investors with positive leverage to profit growth.
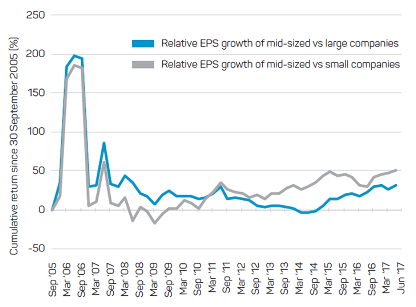
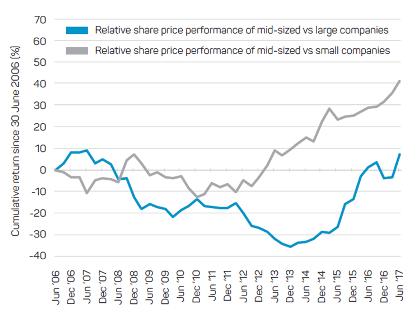
Chart 2 shows that while mid-sized companies grow earnings faster than large ones, the TSR is similar for both segments. This is a function of franking, which encourages mature Australian companies to pay larger dividends to shareholders. Looking at returns excluding dividends (Chart 3) shows that mid-sized companies have delivered better capital returns than either small or large companies.
Chart 2: Relative earnings per share growth of Australian mid-sized companies

Source: Bloomberg, data to 30 June 2017. Past performance is not indicative of future performance.
Chart 3: Australian mid-sized companies’ relative share price performance

Source: Bloomberg, data to 30 June 2017. Past performance is not indicative of future performance.
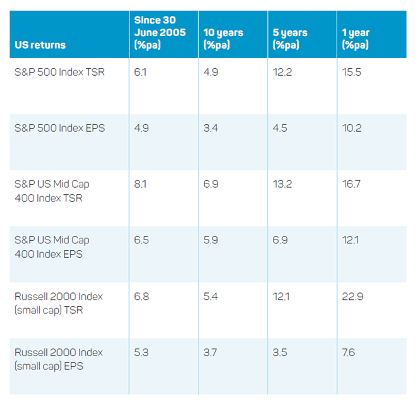
Australia is not isolated in this experience. Chart 4 highlights that Australia’s experience is consistent in other major markets such as the United States. Indeed, not only is the earnings per share growth profile better than other sub-sectors, so too is the total shareholder return.
Chart 4: US share market – large, mid and small cap TSR and EPS

Source: Bloomberg, data as at 30 June 2017. Past performance is not indicative of future performance.
In conclusion, the evidence suggests that mid-sized companies have performed substantially better on average in Australia than smaller companies – both from an EPS and a TSR perspective. In the US, while small caps have had a good 12 months due to surging business confidence following Donald Trump’s election, the same is also true for mid caps over more realistic investment periods.
This challenges well held perspectives about allocating money to small companies for capital growth. In terms of risk, common volatility measures of risk highlight that mid-size companies exhibit lower levels of volatility than smaller companies, further enhancing their appeal. The same is also true of other major markets like the United States.
Of course, large companies continue to appeal to investors due to their apparent “quality” characteristics and historically lower volatility than mid and small caps. However, in an era where disruptive technologies are able to swiftly cut the earnings of mature businesses, earnings quality is at risk for companies no matter what their size.
So if mid-sized companies have provided better capital returns than either larger or smaller companies and have done so with lower risk than small companies, it would appear mid-sized companies are an investment opportunity that may be under appreciated by investors in our market.
1. Total shareholder return (TSR) is any change in capital value plus any dividends received, assumed to be reinvested. For comparison, we have used the following accumulation indices to measure performance: for larger companies, S&P/ASX 20 Leaders Index, for mid-sized companies, the S&P/ASX Mid Cap 50 Index and the S&P/ASX Small Ordinaries Index for small companies. Data commences 30 June 2005, the oldest period consistently available from our source: Bloomberg.
Source : NAB Asset Management October 2017
Important information
This publication is provided by Antares Capital Partners Limited (ABN 85 066 081 114, AFSL 234483) (ACP) a member of the group of companies comprised of National Australia Bank Limited (ABN 12 004 044 937, AFSL 230686), its related companies, associated entities and any officer, employee, agent, adviser or contractor (‘NAB Group’). Any references to “we” include members of the NAB Group. An investment in any product or service referred to in this publication does not represent a deposit or liability of, and is not guaranteed by NAB or any other member of the NAB Group.
This information may constitute general advice. It has been prepared without taking account your objectives, financial situation or needs and because of that you should, before acting on the advice, consider the appropriateness of the advice having regard to your personal objectives, financial situation and needs.
Any opinions expressed in publication constitute our judgement at the time of issue and are subject to change. Neither ACP nor any member of the NAB Group, nor their employees or directors give any warranty of accuracy, not accept any responsibility for errors or omissions in this publication. Examples are for illustrative purposes only.
Bloomberg Finance L.P. and its affiliates (collectively, “Bloomberg”) do not approve or endorse any information included in this material and disclaim all liability for any loss or damage of any kind arising out of the use of all or any part of this material.
This information is directed to and prepared for Australian residents only.
